Order flow analysis is a powerful trading approach that helps traders understand market dynamics beyond traditional price charts. One of the key tools used in order flow analysis is the order flow chart. But what exactly is an order flow chart, and how can traders use it effectively?
What is an Order Flow or Footprint Chart ?
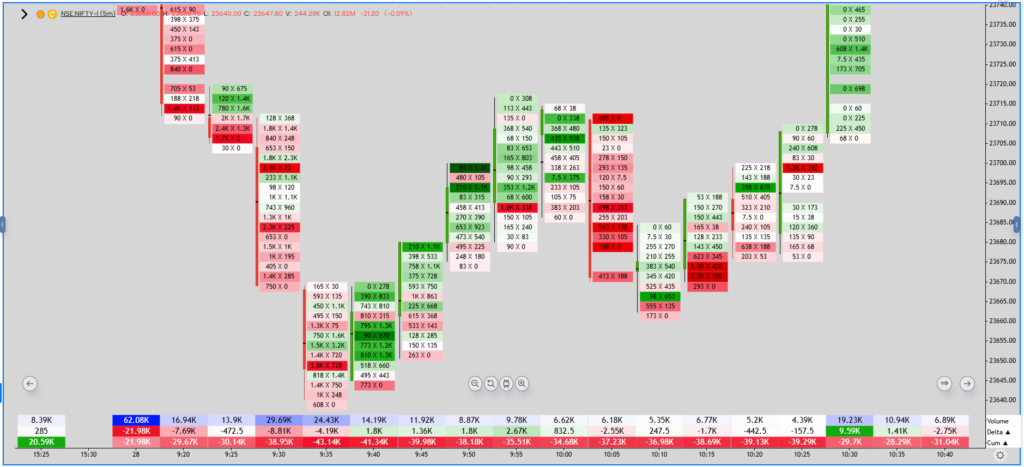
An order flow chart, often referred to as a footprint chart, is a specialized tool that displays detailed market transactions, including buy and sell orders at various price levels. Unlike conventional candlestick or bar charts, order flow charts provide insight into the volume traded at specific prices and show how aggressive buyers and sellers interact.
Order flow charts are commonly used in futures, stocks, forex, and crypto trading to gain deeper insights into market behavior. These charts reveal critical information such as:
Bid and ask volume – The number of contracts bought or sold at each price level.
Delta – The net difference between market buy and market sell orders.
Imbalances – Situations where buying or selling pressure is significantly stronger at a specific price level.
Trapped traders – Instances where traders are caught in losing positions, leading to potential reversals.
How Does an Order Flow Chart Work?
An order flow chart typically consists of volume footprints displayed inside each candle or bar. The footprints highlight:
Buy and sell orders at each price level.
Cumulative volume at specific price points.
Delta values to show market aggression.
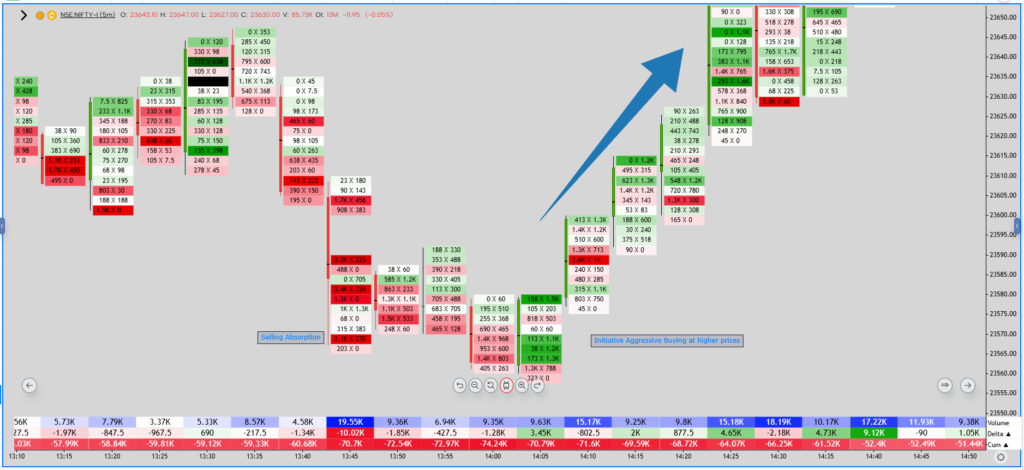
For example, if a footprint shows a high buy delta at a resistance level but the price fails to break higher, it indicates buying absorption, meaning sellers are strong in that zone.
Why Use an Order Flow Chart?
Traders use order flow charts to:
Identify Market Strength and Weakness: Analyze buying and selling pressure at different price levels to determine if a trend is likely to continue or reverse.
Spot Reversals Early: Detect trapped traders, which can signal potential reversals.
Improve Trade Execution: Use real-time order flow data to enhance trade entries and exits.
Enhance Risk Management: Use detailed volume data to place stop losses and targets more effectively.
Common Order Flow Patterns
Some of the most important order flow patterns include:
Absorption: When a large number of orders are absorbed by limit orders, preventing further price movement.
Initiative Buying/Selling: When aggressive buyers or sellers push the market in a new direction.
Exhaustion: When buying or selling pressure weakens, signaling a potential reversal.
Delta Divergence: When price moves in one direction but delta suggests a lack of commitment.
How to Use an Order Flow Chart in Trading?
Confirm Trade Setups: Validate breakouts, pullbacks, or reversals before entering a trade.
Refine Entry and Exit Points: Identify key price levels where buyers or sellers are in control.
Manage Risk Effectively: Place stop losses where market imbalances suggest strong opposing forces.
Monitor Real-Time Order Flow: Keep track of evolving market conditions to adjust your strategy accordingly.
Final Thoughts
An order flow chart is an essential tool for traders looking to gain deeper insights into market dynamics. By understanding the interaction between buyers and sellers at a granular level, traders can improve their decision-making, trade execution, and overall profitability.
If you’re interested in mastering order flow analysis, consider enrolling in our Momentrade courses. Our structured courses cover everything from basic principles to advanced strategies, helping you develop the skills needed for consistent trading success.